

The Unintuitive Truth P2: How a Post-COVID Capacity Crunch Will Disrupt Airport Operations
This blog is powered by data kindly provided by FlightAware
In July 2020, we wrote a blogpost for Airports Council International (ACI) titled ‘The Unintuitive Truth’. In this article, we argued that the industry might be facing a post-COVID capacity crunch. We observed aircraft turnaround times increasing as a result of the COVID pandemic. Key reasons for this increase in turnaround times were found to be parked aircraft, lengthier cleaning routines and slower boarding processes due to physical distancing rules. We looked at potential recovery scenarios and reasoned that as traffic would resume, the longer turnaround times would at least partially remain. Given a fixed number of aircraft stands, this means that even long before reaching pre-COVID traffic volumes, aircraft stand capacity bottlenecks might arise.
We received a lot of feedback from different airports around the world. The main question we were being asked is: “Can you quantify the impact you describe in the article?”. So we decided to dig deeper and perform a quantitative analysis. We created a simulation engine which allows us to simulate COVID recovery steps in 10%-increments for individual airports, and specifically investigate the effects of potential stand capacity shortage.
We found that when the amount of air traffic is back at 80% of pre-COVID levels, airports might not have sufficient stand infrastructure which will lead to an average inbound holding time of 2.5 minutes for arriving flights during peak hour operations. This average waiting time increases further to 18.5 and 30 minutes in 90% and 100% recovery steps respectively.
The Airport Simulator Exposes The Effects Of Stand Capacity Shortage
As the main input variable, our simulator takes an hourly arrival rate of aircraft which are then allocated to available stands. The aircraft will occupy this stand for the length of its turnaround duration and then leave. If there is enough capacity, no waiting time for inbound flights should arise. However, if there are not enough aircraft stands in relation to the aircraft arrival rate, inbound aircraft will have to queue until one of the ongoing turnaround ends and a stand becomes available. Therefore, the key metric we are measuring is the average waiting time of inbound aircraft as a measure of stand capacity.
The inputs for the simulator are pre- and post-COVID arrival rates per hour, turnaround times and airport stand capacity. To get these data for all major airports in the world we turned to our friends from FlightAware. FlightAware is a data intelligence company that uses a combination of technologies and data sources to track nearly all commercial air traffic around the globe. In the spirit of collaboration within the aviation industry, FlightAware agreed to provide us with data of all flights to/from the largest 84 airports in the world for peak weeks in 2019 and 2020.
To simulate the COVID scenario, we took the arrival rate and respective turnaround times for flights at each airport during COVID times. Starting from this baseline scenario, we simulated air traffic recovery in 10 steps. For each step, we increased the arrival rate towards pre-COVID levels. However, we assume that turnaround times will not go back to pre-COVID levels as lengthier cleaning regimes and physical distancing will remain. Furthermore, the checking of COVID test results and/or vaccination passports will cause turnaround durations to remain longer than before. Therefore, we kept longer turnaround durations in the recovery scenarios. We did proportionally reduce the number of parked planes for each incremental recovery step.
Finally, the simulator was run for 31 days for each airport in each recovery step. In the next section we present the outcomes of the simulation. As capacity related topics are typically evaluated based on peak moments, we report findings for the 10% longest waiting times for each airport in each recovery step. This approach, as opposed to reporting an average, ensures that we exclude an averaging between peak and low traffic situations (e.g., night time).
Results: Unintuitive Truth - True Or False?
The average wait time for incoming aircraft to all 84 airports in each recovery step can be found in Graph 1. This time is additional time an incoming aircraft will have to wait – due to the COVID-related factors explained above – until a stand will be vacant.
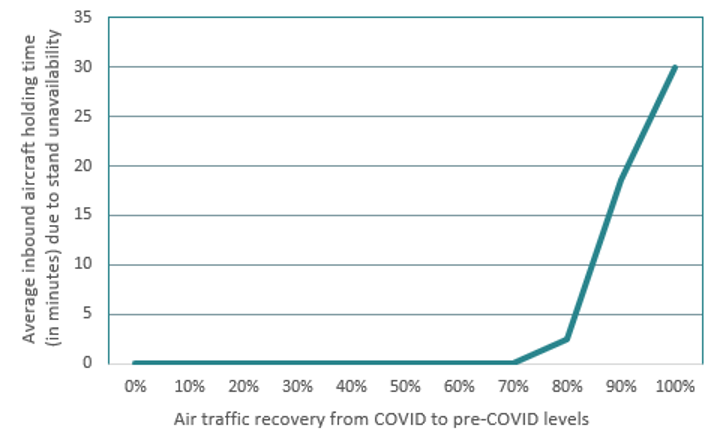
As we can see from the graph, in the 0% recovery step, there are no waiting times for incoming aircraft. As recovery starts, we can see that this situation remains. The amount of available stands is enough to accommodate the increase in traffic with longer turnaround times. However, at 80% traffic recovery, this situation changes. We can see that the average waiting time for inbound aircraft now becomes 2.5 minutes.
Let’s consider for a moment what this means. If you are operating a large airport with somewhere between 50-100 arrivals per hour during peak hour, that means that each of these aircraft will, on average, have to wait 2.5 minutes on the tarmac before being able to taxi into a gate or stand. Besides the cost (kerosene burn) and sustainability (CO2 emission) effects, there will be very few airports that can accommodate this amount of aircraft holding due to space constraints.
As we move towards the 90% and 100% recovery steps, the situation drastically worsens with average waiting times of up to 18.5 and 30 minutes, respectively. At this point, we can clearly conclude that the Unintuitive Truth Effect is definitely real.
Are There Any Differences Between Airports?
The next question is: If we take a closer look, can we see differences between airports? In Image 1, you can see how the average waiting time is increasing as we move through the recovery steps towards 100% recovery for all airports included in the study.
We also analyzed the differences between regions, airport size (based on traffic and stand number) and business level (based on peak hour arrival rate). The results of this analysis can be found in Table 1.
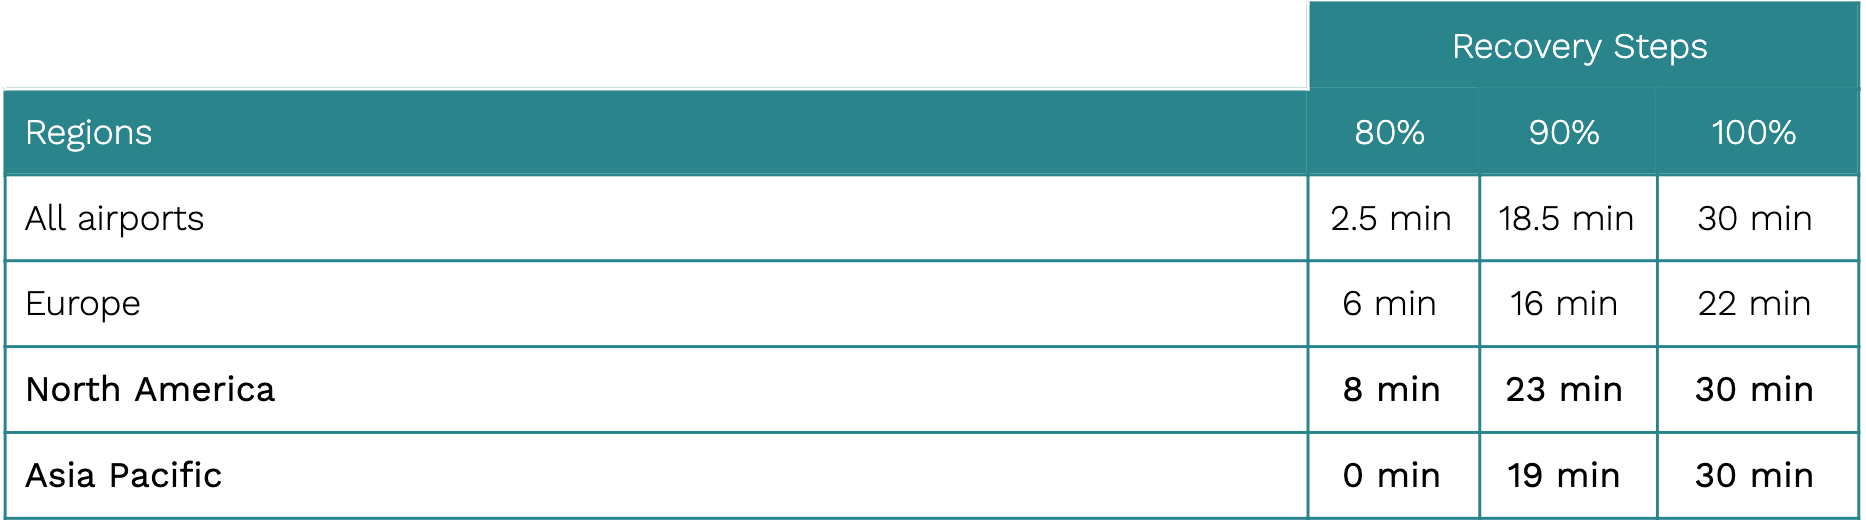
¹ We are not reporting separate results for airports in Latin & Caribbean and Middle Eastern regions due to the extremely small amount of airports in these subgroups.
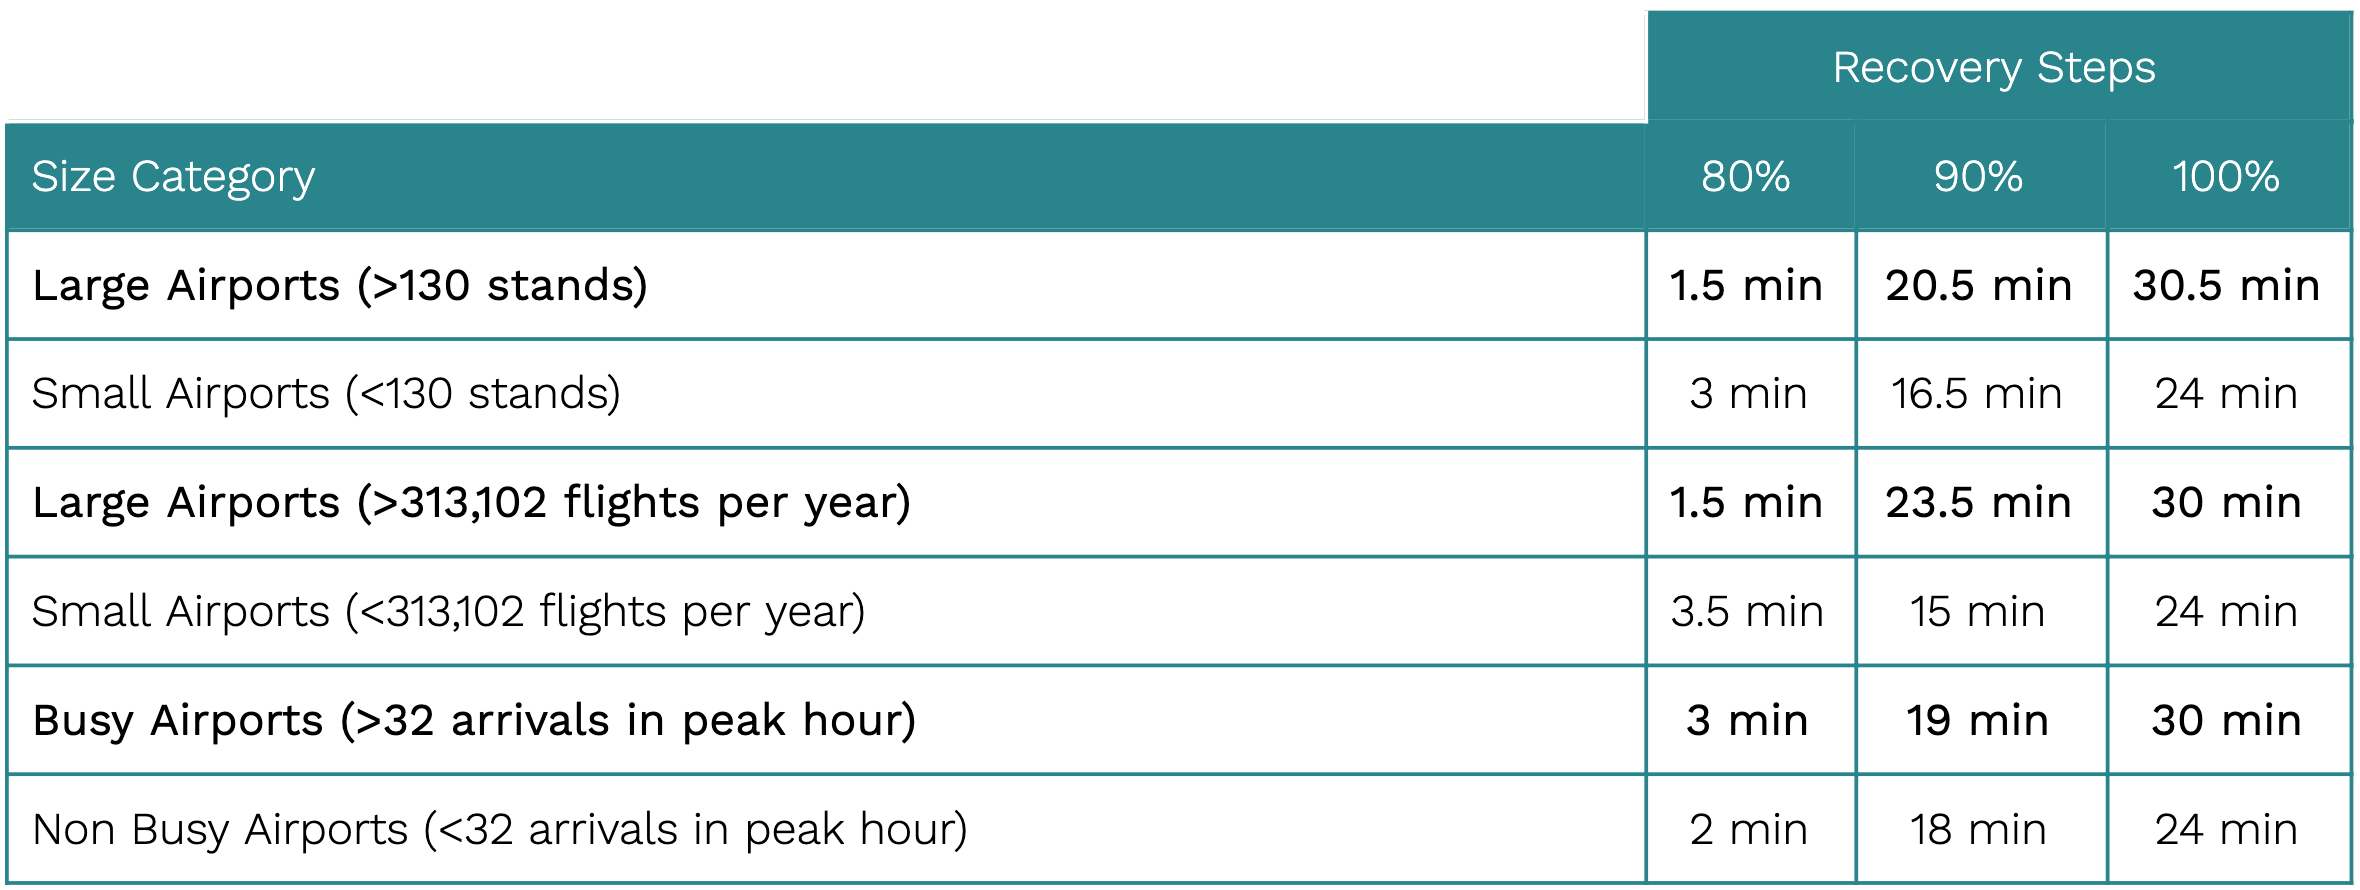
The results in the table should be interpreted with caution as the dataset was unfortunately not large enough to validate the statistical significance of the differences between the different groups (nevertheless, we believe it is informative as it shows a certain directionality). Keeping this in mind, it does seem that European airports are ultimately slightly less affected (22 min average waiting time at 100% recovery) than North American and Asian airports (both 30 min average waiting time at 100% recovery). Furthermore, it seems that larger and more busy airports (30 min average waiting time at 100% recovery) seem to be more exposed to the Unintuitive Truth Effect than smaller and less busy ones (both 24 min average waiting time at 100% recovery).
So, What Does This All Mean?
The findings presented in the previous section validate our theory, and they are also cause for concern. No airport has enough infrastructure available to support this level of aircraft holding without fully congesting the entire airport. In reality, this would lead to flight diversions, in-flight holding patterns and extreme departure delays for flights with a congested airport as its destination.
All of the above would lead to an increase in CO2 emissions and an increase in operational costs, mainly for the airlines. The effects are particularly painful as airlines have already suffered significantly during the COVID crisis. Furthermore, key recovery objectives for many airports and airlines include reducing operational costs and becoming more sustainable. Therefore, the industry must widen its focus from surviving the current crisis towards ensuring a successful recovery. Even though we tried very hard to approximate reality, the results presented are still “only” the result of a simplified airport operations simulation. Therefore, they should be interpreted with some caution. The main goal of this blog post is to support the theory of a post-COVID capacity crunch rather than estimate the exact size of the issue.
What Can Airports And Airlines Do To Prevent A Post-COVID Capacity Crunch?
Now that we have quantitative evidence for a post-COVID capacity crunch and we have discussed the impact it could have, the question arises: how to prevent this from happening? Like in any capacity problem, it is a matter of supply (available aircraft stands) and demand (number of flights x turnaround duration).
On the supply side, it is rather unrealistic to imagine airports currently investing heavily in expensive infrastructure projects to expand capacity. First, even if construction would start today, it is highly unlikely that new stand infrastructure could be finished in time. Second, many airports are already physically limited and simply do not have the space to build additional infrastructure. Lastly, infrastructure projects are typically very expensive and require large upfront investments. Given the financial position of most airports and airlines today, this is definitely an undesirable solution.
On the demand side, there are two variables to consider. The number of flights could be reduced to lower the capacity requirements. However, coming out of the crisis all aviation stakeholders are trying to maximise traffic in order to resume normal operations, repay debt and achieve profitability. Furthermore, different studies have shown that people are eager to travel again. Therefore at least leisure travel is expected to bounce back quickly. This leaves the turnaround duration as the only variable to influence in order to prevent a post-COVID capacity crunch.
Initiatives to optimize turnarounds and reduce their duration are not new. However, as the coming months and years will still hold a relatively high degree of uncertainty, it will be more difficult than ever to manage turnarounds efficiently.
First Step: Turnaround Data Will Be Key For Controlling Turnaround Times
Here’s where another non-novel concept applies: “You can’t manage what you can’t measure”. In order for airports and airlines to be able to exercise control over turnaround operations, they will first need data about these operations. Accurate and real-time turnaround data can be used in two ways to ensure efficient operations and minimal turnaround times.
Historical turnaround data can be used to compare performance against existing plans. As new rules, regulations and protocols are being implemented, planners will make assumptions and plan aircraft turnarounds based on these assumptions. These planners require feedback loops in order to get validation from the actual operations in order to change plannings and schedules. Only by continuously analyzing the current performance can areas for improvement be found, improvement initiatives be suggested and the success of these initiatives be evaluated.
Real-time turnaround data can be used on the day of operations to ensure that deviations from the schedule are picked up as quickly as possible and effects on the turnaround duration can be minimized. Turnaround management systems will be especially helpful during this recovery period where the “optimal” turnaround might be different from day to day and rigid schedules and routines from the past are (partially) useless.
If you are interested to know more about the Unintuitive Truth Effect specifically for your airport or if you are interested in our solutions to minimize turnaround durations contact us at ch@assaia.com or via the website form.


